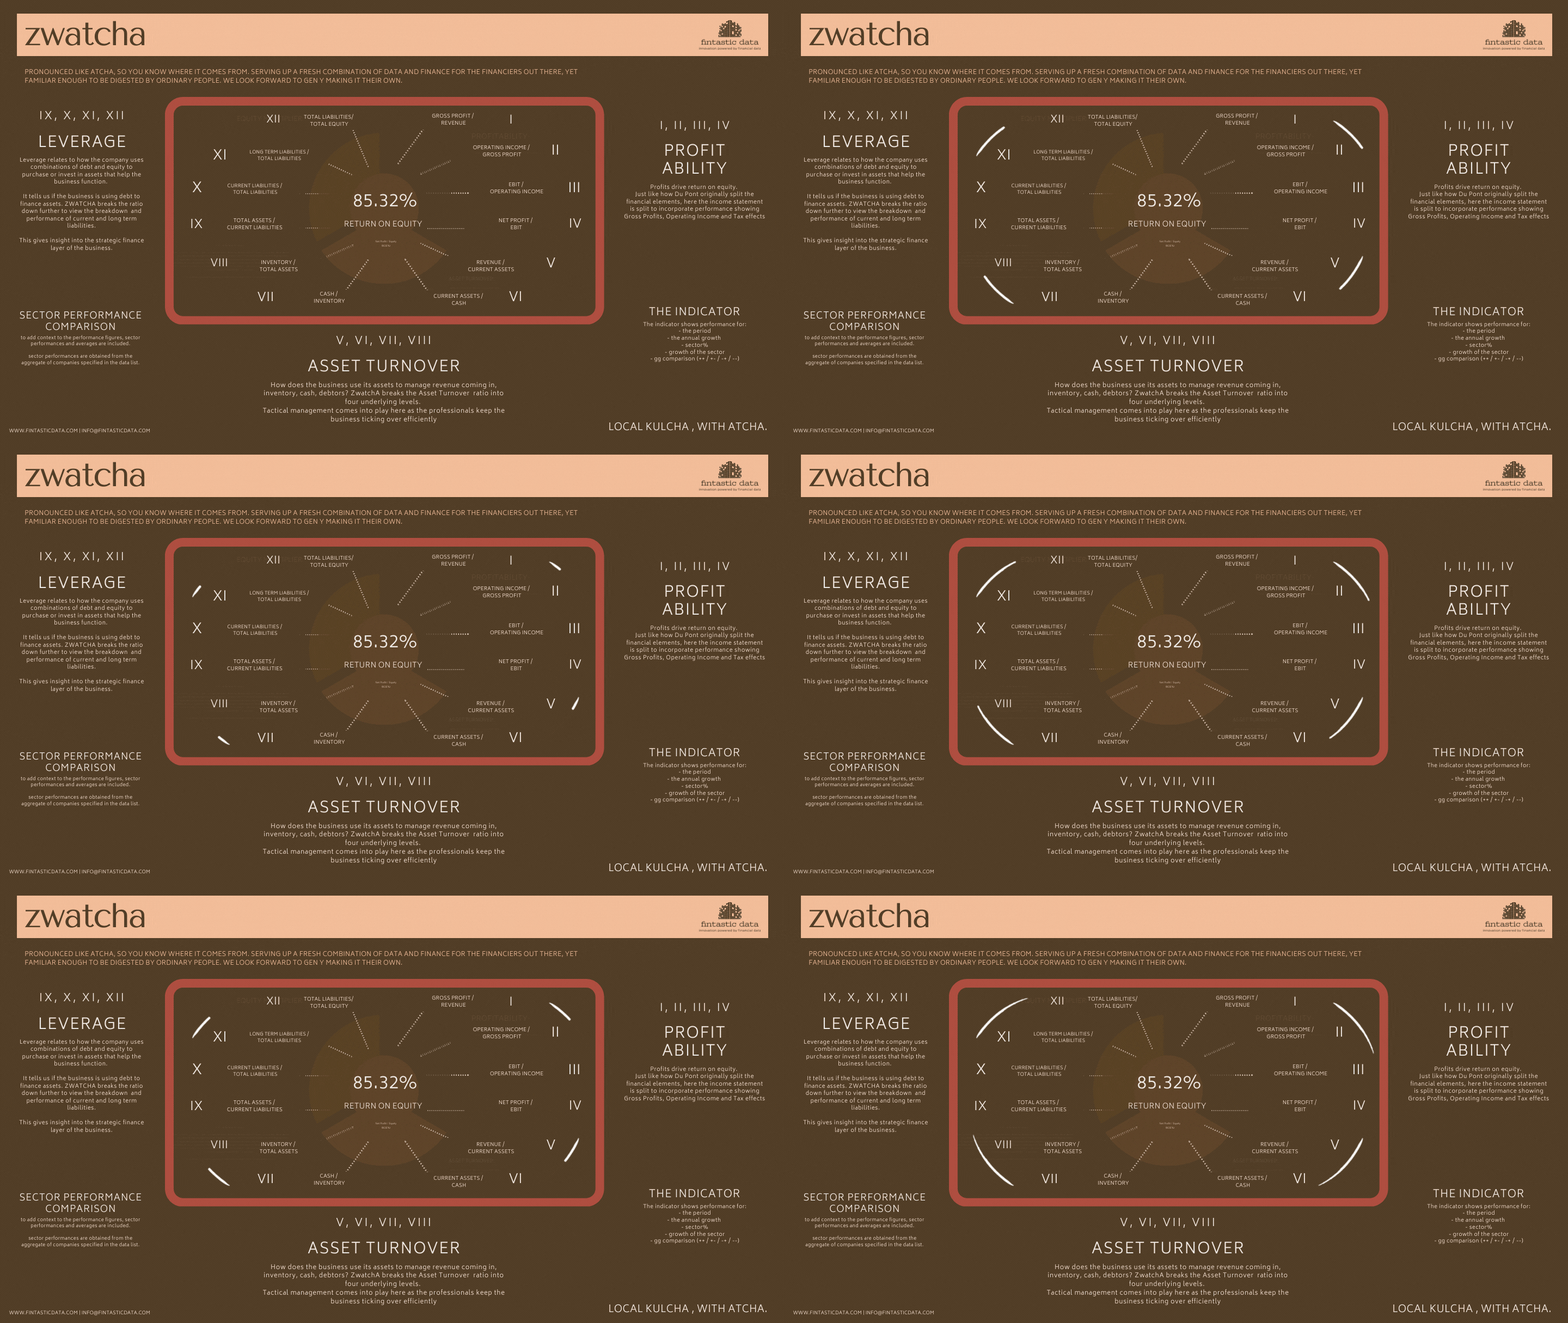
Power BI is a business intelligence and data visualization tool that can be used by finance professionals to analyze and visualize financial data. There are several dashboards that finance professionals can use in Power BI, some of which include:
Financial Performance Dashboard: This dashboard provides an overview of the company's financial performance, including revenue, expenses, profit margins, and key performance indicators (KPIs).
Cash Flow Dashboard: This dashboard helps finance professionals monitor cash flow by tracking cash inflows and outflows, identifying cash shortages or surpluses, and predicting future cash flows.
Budget vs. Actuals Dashboard: This dashboard compares actual financial results to budgeted amounts, highlighting areas where actual performance deviates from the budget.
Financial Forecasting Dashboard: This dashboard uses predictive analytics to forecast future financial performance based on historical data and market trends.
Accounts Receivable and Payable Dashboard: This dashboard tracks the company's accounts receivable and payable, aging of outstanding invoices, and payment trends.
Investment Performance Dashboard: This dashboard tracks the performance of the company's investment portfolio, including return on investment (ROI) and risk metrics.
Sales and Revenue Dashboard: This dashboard provides insights into sales trends, revenue streams, customer segments, and sales performance by region or product.
Financial Risk Management Dashboard: This dashboard helps finance professionals manage financial risks by tracking key risk indicators, such as interest rate risk, credit risk, and liquidity risk.
Overall, the dashboards available in Power BI can help finance professionals gain deeper insights into their company's financial data, make data-driven decisions, and optimize financial performance.


